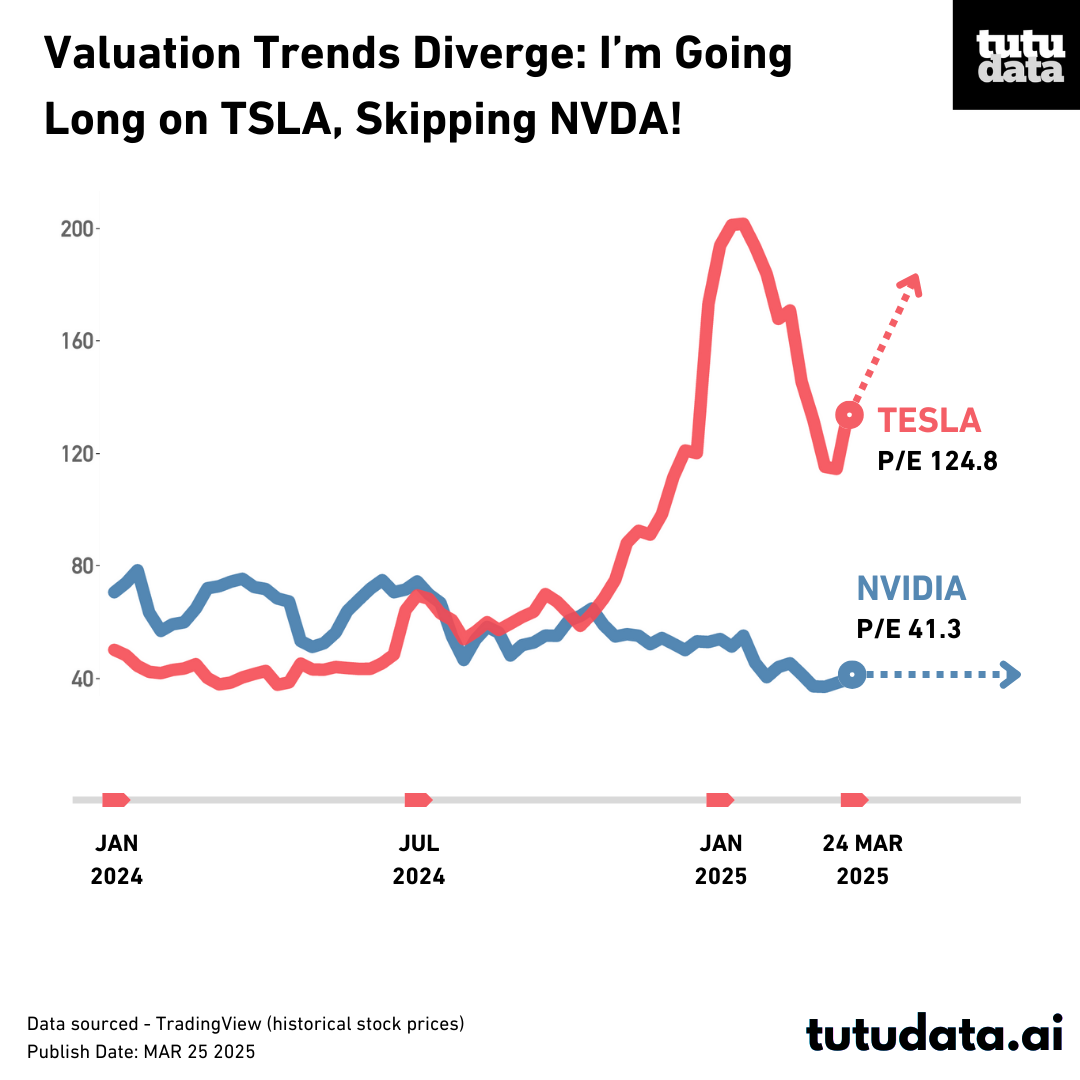
Our 15-month P/E chart reveals stark valuation trends for TSLA and NVDA. TSLA’s P/E, after wild swings from 940.89 in 2020 to 30.64 in 2022, dropped to 124.84 from 161.23 on March 21—a 46% discount to its 5-year average (229.65). This signals a valuation repair reversal, especially after its 11.93% rebound on March 24. I’m going long on TSLA, targeting a short-term trade with plans to take profits between April 7-11, 2025, in the $330-$350 range, given its strong momentum. Conversely, NVDA’s P/E fell to 41.32 from 52.09, continuing a 13% YTD downtrend. Its 3.15% gain on March 24 is just a splash in a weak trend, with no reversal in sight. I’m skipping NVDA due to its lack of momentum.
I’m long on TSLA, targeting $330-$350; NVDA remains a pass. Find trading ideas at tutudata.ai!
Disclaimer:
All content published on this website represents the analysis, conclusions, and trading actions of tutudata.ai. It is not intended as investment advice for readers. Readers should conduct their own research and make independent decisions before taking any investment actions. Trading involves risks, and past performance is not indicative of future results.